Not only are returns a drain on profitability, they are also highly inefficient. Returns typically require additional handling from many resources, including distribution, warehouse operations, customer service, finance and even sales and marketing.
Just think about all the work involved in processing a returned product. Someone has to receive, inspect and validate each returned item. Someone has to issue credit to the customer. Someone has to repackage, restock, destroy or make some other decision about the product.
And throughout this process, customer service is fielding multiple calls from the customer about returns policies, shipment disposition, credit status and reship information.
With these costly processes, it’s not surprising that 46% of companies lose money on returns. According to our new survey, about a quarter break even, and only 8% claim to make money on returns.
The study, conducted at the end of the summer, polled thousands of shippers on the subject of parcel returns, including readers of Multichannel Merchant, The Journal of Commerce and Parcel magazines. The results were presented at the 2009 Parcel Forum in October and are published here for the first time.
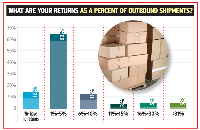
The overall percentage of returns compared to outbound shipments is relatively small — the plurality of respondents (63%) say their returns are 1% to 5% of outbound shipments. But 10% say returns are more than 16% of outbound shipments. Return rates exceeding 30% are not uncommon in fashion apparel.
Still, returns are a problem area for many merchants trying to hold the line on costs. Let’s take a closer look at some of the findings.
Why customers return products
The growth in online retail contributes to rising returns rates because online orders inherently have higher returns for a number of reasons:
Product is unseen and upon receipt, may appear different from how it looked on the Website or in the catalog. The customer often changes her mind about the purchase by the time the shipment is received. Also, some consumers will routinely order different colors and sizes of a particular item and then return the unwanted items. Inventory availability, delivery and product assembly challenges also contribute to higher returns rates.
Many of these factors are unavoidable. But the chart below shows factors that could be controlled — such as the number-one reason reported for returns: a defective or damaged item.
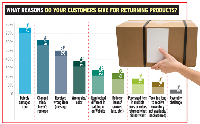
Misships, another occurrence that can be controlled by the merchant, were the number-three reason. Delivery problems and inventory issues are also potentially avoidable. Leading retailers minimize costly returns and improve the customer experience by shipping the right order on time.
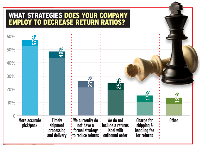
Although many companies lose money on returns, more than a quarter of survey respondents do not have a strategy to reduce them. To reduce the instances of returns, retailers must develop a plan or measure for ongoing improvement.
But there is a direct correlation between flexible returns practices and future customer orders. According to a package deliver study by Comscore, 85% of online shoppers reported that they would not buy again from a merchant if the return process were not convenient. On the other hand, if the return process is convenient, 95% would buy again.
Zappos has made its liberal returns policy a competitive differentiator: The online shoes merchant offers free returns, no questions asked. While Zappos’ returns rate is better than 35%, the company boasts extremely high reorder rates, customer satisfaction and loyalty.
Convenience plays a major role in customer satisfaction. Yet only 21% of shippers include a return label with the outbound order
When determining returns policies, retailers need to make decisions regarding the tradeoff between customer satisfaction (low cost or free returns for any reason) and profitability (limits on returns with customer participation in the costs).
Who pays the cost?
On the issue of the cost obligation, survey responses were fairly evenly split between customer, merchant and shared costs of return shipments. Twenty percent of the respondents say that at their companies, the customer pays all the costs; 29% say they pay all the costs; 24% say the cost is shared but the customer pays most, and 27% say it’s a combination, but that they as the merchant pay most of it.
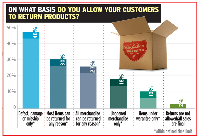
There is a split between strict policies that allow returns for defective and/or unopened items only, and more liberal policies that allow most or all purchases to be returned for any reason.
About half the survey respondents (48%) have a 30-day limit on returns. Eight percent limit returns to within 60 days, 10% limit them to within 90 days and 12% will accept returns within a year. Just 3% of respondents will take back returns after more than a year, and 18% have an “other” time frame for returns.
Charge back policies also varied. Some merchants — 6% of respondents — charge customers for returns based on a flat rate, while 15% charge based on a percentage of the dollar value of the order.
Others try to recapture actual carrier costs (10%), while 7% add a shipping and handling fee to the freight costs. Forty-two percent don’t charge for returns that are due to incorrect order fulfillment or product damage, while 19% don’t ever charge for returns, regardless of the reason.
Rob Martinez ([email protected]) is a partner at parcel consultancy Navigo Consulting Group.