There’s very little the world can throw at U.S. consumers to keep them from spending money,” a reporter for CNN/Money wrote in February 2003. Consumers were spending relentlessly, he said, despite terrorist attacks, a recession, millions of lost jobs, corporate accounting scandals, a long-drawn-out bear market, and a looming war in Iraq.

Two years later, little has changed, except that the Iraq war has become a reality. Economists tell us that consumer consumption fuels a staggering two-thirds of the $11 trillion U.S. gross domestic product.
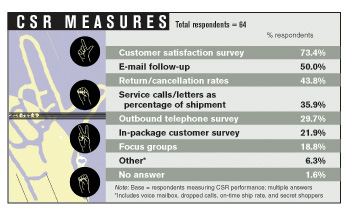
That being the case, you’d think merchants would fall over themselves trying to please those avid buyers of their products and services. But just the opposite is true; if anything, customers appear to have declined in importance in the two years since O+F last conducted its CRM and customer service study. Back in 2003, 70.3% of our respondents formally measured customer service; this year, only 58.7% do so. Those who measure service levels seem to rely less on face-to-face communication — their use of focus groups has dropped from 28.8% in 2003 to 18.8% this year. Not surprisingly, this correlates with an increase in e-mail follow-up, from 37.8% to 50%.
GONE WITH THE WIND
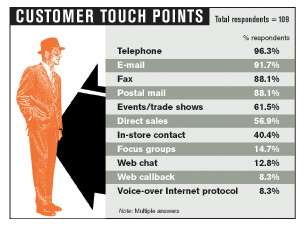
At the same time, retailers have increased the variety of channels through which they sell merchandise. The percentage of respondents offering brick-and-mortar outlets has risen markedly, from 39.2% in 2003 to 47.7% this year. Online businesses have seen a boost as well, from 79.7% to 83.5%. The customer service division, however, remains frozen in time. The primary customer touch points offered are almost exactly the same as they were two years ago: phone, e-mail, fax, and postal mail. Web chat and Web callback mechanisms have actually declined in usage, the former from 14.6% to 12.8%, the latter from 10.8% to 8.3%.
BUDGET BUSTER
What’s more, far fewer retailers even plan to provide online touch points that deviate from the standard fare. Two years ago, our respondents were high on high tech — 22.8% planned to offer Web chat, 20.9% said they would provide a Web callback option, and 20.9% planned to install voice-over Internet Protocol (VoIP). Today, those numbers have fallen to 12.8%, 13.8%, and 9.2%. In-store customer contact has increased, though, with 40.4% — up from 34.2% in 2003 — of the respondents supplying it, probably to keep pace with the growth of brick-and-mortar retail outlets. The number of respondents offering events and trade shows has also increased, from 57% to 61.5%.
Perhaps the most telling comment on the state of customer service is the steep decline in the number of CSRs that merchants employ. In the past two years, the percentage of respondents employing just one to four full-time customer service agents has more than doubled, surging from 13.9% to 29.4%. Part-time workers have fared even worse. An overwhelming 71.6% of our respondents do not employ any part-time CSRs at all; back in 2003, that number was only 5.1%! Offshore outsourcing and corporate cutbacks are no doubt responsible for this state of affairs, but with such lean service departments, how do companies plan to keep all those customers they pursue so lustily?
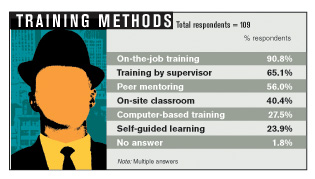
The few CSRs who remain receive less formal training than in years past. This year, 40.4% of our respondents say they provide on-site classroom training, a significant decrease from the 58.9% that did so in 2003. And this year’s group relies somewhat less on supervisors to show newcomers the ropes — 65.1% use this method, down from 73.4% two years ago. The upside is that the average training time for new CSRs has increased, with 30.3% of our respondents now offering one to three months of training. In the previous survey, only 19.6% provided that amount of time; nearly 70% trained their agents for just four weeks or less.

Never particularly interested in customer relationship management (CRM) applications, our respondents could hardly be expected to install them in straitened economic circumstances. Two years ago, fewer than a third of companies had implemented CRM technology, and that proportion remains the same today. About a fourth of our respondents did not plan to use CRM in 2003; that number is still the same as well. And guess whose budget got the axe? In our previous survey, 32.6% of the respondents with CRM technology boasted a budget of $100,000 or more; currently, a mere 9.2% have that amount.
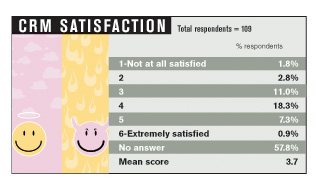
Among those respondents using CRM, technical capabilities are all over the place — everyone has a smattering of this and that. Between 10% and 20% of the respondents with CRM report using such esoteric tools as customer insight analysis, multilingual module support, case management, partner relationship management, and server-to-server database synchronization. Fewer respondents have invested in what used to be considered the strengths of CRM applications — the ability to gather business intelligence and personalize customer contact. Respondents with BI tools have declined from 60.9% of CRM users to 28.4%, and users of personalization programs have dropped 56.5% in 2003 to 29.4% this year. Satisfaction with CRM packages, rated on a scale of 1 to 6, with 6 equaling “extremely satisfied,” hasn’t changed much, with mean scores of 3.9 in 2003 and 3.7 in the latest survey.
Rama Ramaswami is editorial director of Operations + Fulfillment. Primedia Business research manager Thomas Grant conducted the research for this report. To purchase a copy of the full study, visit www.opsandfulfillment.com.
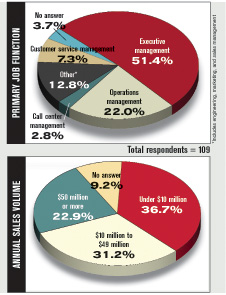
Methodology
On Nov. 3, 2004, Primedia Business Marketing Research mailed cover letters and two-page questionnaires (each containing 16 questions) to 1,000 domestic O+F subscribers selected by call center, customer service, operations, and executive management job functions on an nth name basis. Data collection took place until Nov. 22, 2004, and 109 completed surveys were received, for a response rate of 11.0%. Means and medians were calculated according to standard statistical practices. Totals may not add up to 100% because of rounding. Results were reported in three categories: companies with annual sales under $10 million (36.7%), between $10 million and $49.9 million (31.2%), and $50 million or more (22.9%); 9.2% did not provide sales information. The majority of respondents (73.4%) hold positions in operations or executive management. In the “Other” category, 12.8% of respondents cite jobs in fulfillment, engineering, marketing, sales, CRM, or database management.— RR