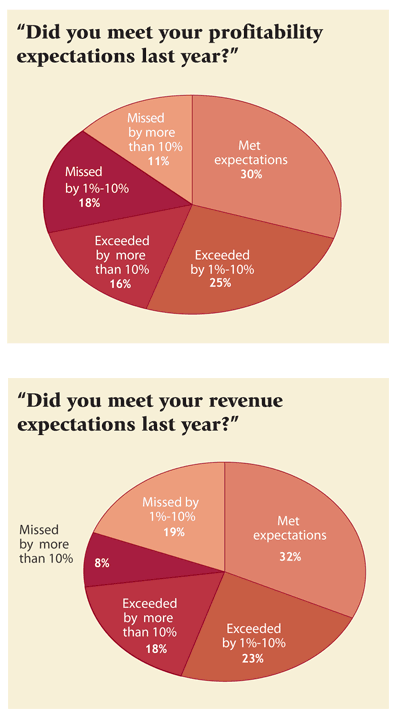
At first glance, the financial picture for the respondents to Multichannel Merchant’s Benchmark Survey on Critical Issues and Trends looks rosy. Seventy-one percent said they’d met or exceeded their profitability goals the previous year. That’s down a scant three percentage points from 74% of last year’s respondents and up significantly from 63% of respondents in 2004 and just 51% of respondents in 2003.
On the sales side, the numbers were even better: 73% of this year’s respondents had met or exceeded their revenue expectations the previous year, compared with 70% of last year’s participants, 64% of respondents in 2004, and 58% in 2003.

But there’s a huge difference in results between business-to-consumer respondents and their business-to-business counterparts. Among the b-to-c merchants surveyed, only 59% met or exceeded their profit goals, compared with 83% of the b-to-b respondents. The discrepancy is just as dramatic when it comes to revenue: While 65% of the consumer merchants met or exceeded their sales goals last year, 85% of the b-to-b respondents did.
CONCERNS ABOUT GROWTH
The gap narrowed during the first half of 2006, though — to the benefit of the consumer merchants. During the first six months of this year, 67% of the b-to-c respondents met or exceeded their profit goals, as did 75% of the b-to-b merchants. On the other side of the ledger, two-thirds of the consumer merchants exceeded their revenue goals for the first half of the year, as did 76% of the b-to-b respondents.
Looking ahead, 70% of respondents said they expected their company’s revenue to grow at least as much during the next 12-24 months as it had during the previous two years. That’s down just two percentage points from last year’s respondents.

But last year an impressive 45% of respondents had expected future sales growth to outpace that of the recent past. This year only one-third said the same. And 37% of this year’s participants expected sales to grow at the same rate going forward as they had during the past two years, compared with 27% of last year’s respondents.
A look at the major concerns of this year’s respondents hints at why their outlook is slightly less sanguine. The number-one marketing concern was finding prospects: 43% of respondents cited it as one of the top three marketing issues facing their company. And of course, if you can’t find prospects to profitably convert to customers, it’s all but impossible to rev up growth.
Interestingly, respondents were less concerned with retaining customers. Only 24% cited retention as a top marketing worry, placing it below such issues as managing multiple marketing channels (35%), determining the optimal marketing media mix (35%), and rising catalog distribution costs (29%).
THE MEDIUM AND THE MESSAGE

The top management-related issue, and the most frequently cited worry overall, remained the need to cut costs without reducing offerings and services. Sixty-nine percent of respondents said it was among their top three management issues, down somewhat from 83% of last year’s respondents. Determining the optimal allocation of resources was the second most cited management concern, with 49% ranking it among their top three.
Inventory forecasting was the most pressing merchandising and operations concern among respondents, with 51% citing it. Forty-five percent named rising package-delivery costs as one of their top three merchandising/operations concerns, making it number two in that area.
It’s not surprising that so many survey respondents listed optimizing their marketing media mix and managing multiple channels as major concerns; after all, there are so many media and channels to consider. Respondents with print catalogs, for instance, promoted their books via their own Website (90%), e-mail (76%), solo mailers and other noncatalog forms of direct mail (38%), space ads (32%), and banner ads on third-party Websites (29%), to name just the most popular media.
These methods must be working for them. When respondents were asked which media they planned to use to promote their print catalog in the coming year, their answers were pretty consistent. A few more respondents planned to launch e-mail campaigns, bringing the portion of those who intended to promote their catalogs that way next year to 81%. In fact, among those with e-mail marketing campaigns, the majority (52%) said that response had increased during the past year. That increase, combined with e-mail’s relatively low cost, makes the medium a must-test for nearly every multichannel merchant that hasn’t yet tried it.
INCOME AND OUTFLOW

More respondents also intended to add third-party banner ads to their catalog marketing mix: 38% planned to use them in the next 12 months, compared with 29% who were already using them. And whereas only 6% of respondents said they already used online services such as AOL to promote their print catalogs, 12% planned to do so next year.
E-mail was the most popular medium among our respondents for promoting Websites. Seventy-eight percent of those with Websites used e-mail as a marketing tool — and 86% intended to do so next year. Print catalogs were the second most popular medium for promoting a Website, with 71% using them now and 74% intending to next year.
Rounding out the top five media currently used to promote Websites are paid search (50%), banner ads on third-party Websites (35%), and affiliate marketing (33%). But while the number of respondents who intended to use search and banner ads again next year held steady, 41% expected to use affiliate marketing — a year-over-year increase of eight percentage points. Usage of noncatalog direct mail is likely to grow even more: 11 percentage points, from 27% to 38%.
Although a mean 1.4% of respondents’ total revenue came from list rental income, those who made money from renting out their files are in the minority: A full 70% of respondents made no money from list rentals.
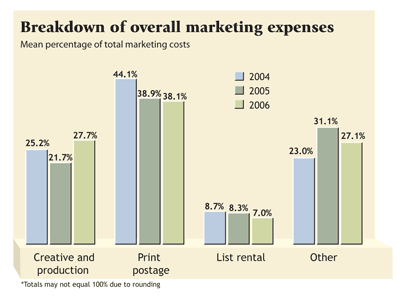
On the other hand, renting names accounted for a mean 7.0% of respondents’ marketing expenses. That takes into account the 40% who said they spent nothing on list rental.
METHODOLOGY
Printing and postage accounted for the plurality of respondents’ marketing expenses — a mean 38.1%. Creative and production costs were the second largest marketing expense, accounting for a mean 27.7% of the marketing budget.

A mean 6.2% of respondents’ revenue came from shipping and handling income, even though 41% said they derived no S&H income at all. Among many of those who did reap revenue from S&H, however, the rewards were appreciable: 16% of those who made money from shipping and handling said it accounted for more than 10% of their total revenue, and another 31% reported that it made up 6%-10% of their total revenue.
Overall, however, shipping and handling costs accounted for a mean 28.1% of respondents’ operations expenses. Labor accounted for the lion’s share of operations budgets, at a mean 55.9% — and for 42% of respondents, labor accounted for more than 60% of their operations costs. Credit-card fees and other miscellaneous expenses accounted for a mean 16.0% of respondents’ operations budgets.
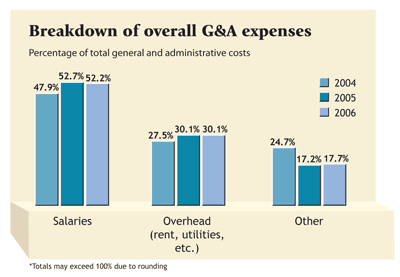
Operations was the largest of the three major expense categories, with it accounting for a mean 41.5% of respondents’ revenue. Survey participants spent a mean 33.8% of revenue on marketing expenses, with general and administrative costs accounting for a mean 24.8%.
On Oct. 4, Prism Business Media e-mailed invitations to participate in an online survey to 13,182 subscribers of Multichannel Merchant selected on an nth-name basis. The invitation contained a link routing respondents directly to the questionnaire. Respondents were offered a change to win one of four $50 Amazon.com gift certificates. Follow-up e-mails were sent on Oct. 10 and Oct. 17. Of 10,654 deliverable e-mails, 156 surveys were completed, for an effective response rate of 1.5%.