A successful company is one in which the merchandising team religiously measures the key metrics that impact the profitability of its catalog and ecommerce programs. A successful company also avoids “siloing” data by discipline. Rather, everyone—marketing, merchandising, operations, creative and finance—shares their key metrics.
This is especially true with merchandising’s key metrics, because product is still the primary driver of your business success. Think of any multichannel company: What defines that company is the merchandise it offers—be it Garnet Hill, Vermont Country Store or Lillian Vernon. Therefore, to be successful a company must have the right merchandise at the right price, and must deliver it to the customer when the customer wants it. The key is to determine the right mix of merchandise and pricing.
For a long time, merchandising was thought to be more art than science. But in today’s multichannel world, “gut-feel” will no longer suffice. Yes, there will always be some “art” in product selection. But the key metrics, the “science,” when applied, truly help a company to select the “right stuff.”
Following is a checklist of the key metrics that every merchandiser should incorporate into its product-selection strategies. The key metrics controlled by the merchandising team fall into four areas: sales, performance, margin and inventory. These metrics should be measured at both the category and total event level.
SALES
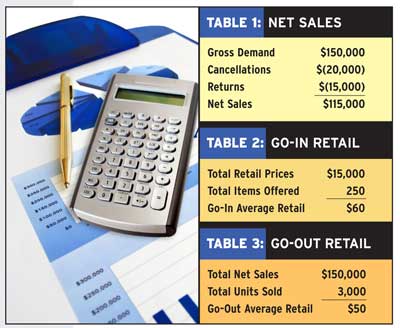
- Gross demand: This is what the customer wanted, whether you could supply it or not. Capturing this information is critical to measuring performance and planning. This is easy in a catalog but difficult in ecommerce; the issue is how to capture true demand without upsetting your customer.
- Cancellations: This could be the company’s responsibility—perhaps a vendor’s order did not arrive, or the customer canceled because she received your delay-in-shipping message.
- Returns: What is the cause of returns? Is it poor quality, sizing issues, value for the price? Something else? Since the merchandising team owns the vendor relationship, it is their responsibility to control returns.
- Net sales: This is achieved by subtracting cancellations and returns from gross demand. Too many companies focus on net sales, as it is money in the bank. But they should be focused on the gross demand because that shows the potential. Shipping-and-handling income should not be included because it inflates net sales and is an operational metric.(See Table 1.)
PERFORMANCE
- Go-in/go-out retail: This metric allows the merchandiser to see if the consumer’s purchasing decision, from a price-point perspective, matches what was offered. If the go-in is too high or low versus the go-out, then there is a product and pricing mix issue. This calculation should be done at the category level. To calculate go-in/go-out you:
- Go-in, add all the retail prices in a catalog or on the website to get total retail prices, and divide by total items offered for go-in average retail. This assumes that every item will sell an equal number of units. (See Table 2.)
- Go-out, take total net sales at the end of a cycle divided by total units sold to arrive at go-out average retail. Be sure to eliminate the top and bottom 5% of items in dollar sales to prevent distortion. (See Table 3.)
- Category/price-point analysis: Do this by comparing the relationship of the dollar sales to the number of item offerings by both category and price point. (See Table 4.)
- Vendor performance analysis: Include initial fill-rate, on-time delivery, number of shipments to complete orders, customer returns, back orders and cancellations.
- Square inch analysis: This measures productivity in allocated space for an item, but cannot measure the other “impacts” on sales. Is it new? Is it in a “hot-spot”? Is it on the cover? Is it an exclusive to your brand? In ecommerce, the space is “democratic,” but again—how do you account for home page features, sale offers, etc.? If you do square inch analysis, be sure to develop a method for allowing for these “impacts.”

READ ON FOR MORE KEY METRICS >>>
MARGIN
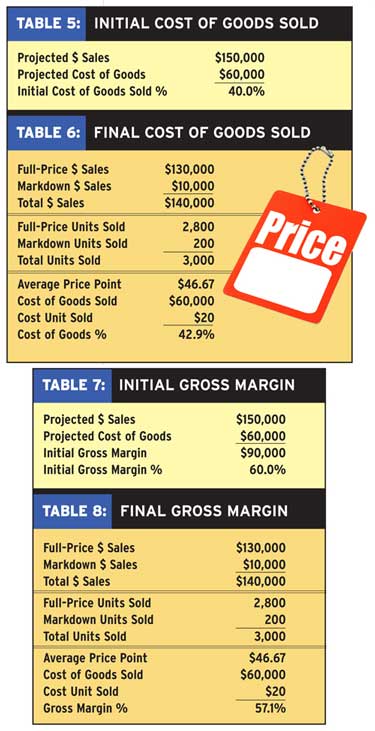
- Initial gross margin: This is a percentage that covers marketing, operations and overhead expenses. Take the projected sales less the projected cost of goods to get your Initial gross margin. Initial gross margin divided by projected sales is initial gross margin %. (See Table 7.)
- Cost of goods sold (COGS): This should be examined in both dollars and in percentage. Start with Initial COGS and then measure after the season is complete.
- Initial COGS, projected cost of goods divided by projected sales is initial COGS percent. (See Table 5.)
- Final COGS, total sales divided by total units sold is the average price point. COGS divided by total units sold is cost unit sold. Cost unit sold divided by average price point is COGS percent. (See Table 6.)
- Final gross margin: Total sales divided by total units sold gives the average price point. COGS divided by total units sold is the cost unit sold. Subtract cost unit sold from average price point and divide by average price point for gross margin percent. (See Table 8.)
INVENTORY
- Inventory management/planning: If this is a responsibility of the merchandising team, then it is a key metric because it directly impacts order fulfillment, expenses related to back orders, markdowns and customer satisfaction.
- Initial fill-rate: This measures how many orders are filled complete in one pass. Some companies will not mail their catalogs or turn on their associated websites until 75% to 80% of the product is in the warehouse.
- Inventory turns: These are both a goal and a measurement of how big an inventory investment a company must make. If merchandise is imported, there will often be lower inventory turns due to lead times and higher inventory investment. This should be measured by category, seasonally and annually, for monetary and customer satisfaction control.
If a company’s merchandise team uses and shares these key metrics, the company’s sales and profitability will be better. Moreover, as you improve merchandise selection and pricing by using these key metrics, you will improve conversion and traffic for both your catalog and ecommerce programs.
Kathleen Schultz ([email protected]) is a multichannel merchandise consultant.