The world is a merchant’s oyster, according to respondents of Multichannel Merchant’s 2005 Benchmark Report on Merchandising. Sixty-nine percent of respondents this year, up 10 percentage points from last year, sourced outside the U.S., indicating that more are looking abroad for unique merchandise. The percentage taking domestic sourcing trips decreased a statistically insignificant three percentage points, to 87% from 90% in 2004.
Those surveyed reported finding a mean 20.5 products on international sourcing trips and 13.9 products on domestic sourcing trips. But while the number of products found on international sourcing trips rose from 19.1 products among 2004’s respondents, the mean amount of products respondents selected on all sourcing trips that actually made it into the catalog remained all but flat: 41.0%, compared with 40.1% last year.

Sourcing
Despite a rise in international sourcing trips, respondents did not rank traveling abroad as a top method of sourcing products. On a scale of one to five, with five being the best, manufacturers were rated the number-one source of new items, with a ranking of 3.7. Overseas sourcing trips followed with a 3.5 ranking, and domestic sourcing trips and customers tied with a 3.4 ranking. The most common form of sourcing for new products, internal brainstorming, was used by nearly all respondents this year — 98% — yet ranked fourth as a method of sourcing new products.

Where respondents sourced remained consistent with last year’s findings. The U.S. topped the list, with 98% of respondents sourcing domestically. Sixty-six percent of those surveyed sourced products in the Far East, 43% in Canada, and 41% in Europe.
This year’s respondents shared their sourcing tasks with more people. An average of 5.0 people sourced for respondents’ primary catalogs, up from 3.3 people last year. More than three-fourths (77%) of those who sourced for the catalog did the same for the Web.
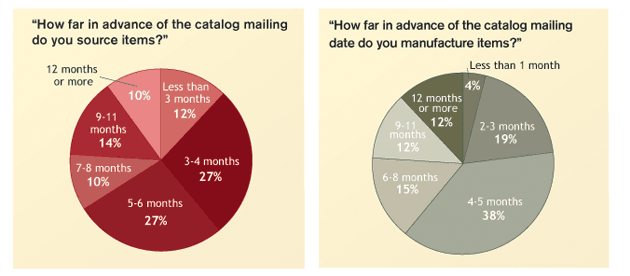
Perhaps because of increased sourcing internationally, sourcing time prior to a catalog mailing increased to a mean 6.3 months from last year’s mean 5.9 months.

Buying and manufacturing
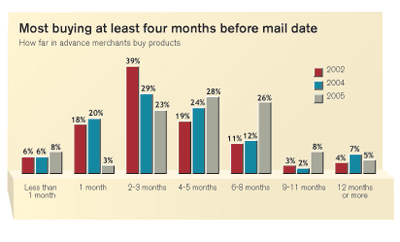
Respondents to this year’s survey said they purchased items an average of 5.1 months in advance of a mailing. That’s further in advance than last year’s respondents, who bought on average 3.9 months prior to a mailing.
Riding on the crest of increased international sourcing trips, 44% of those surveyed this year said they planned to increase their import activity, compared with 28% of last year’s respondents. Plans to decrease importing held steady at 6%.
Respondents bought a mean 49.0% of projected volume initially, compared with 37.3% in 2004. The number of rebuys on an item tracked with the increased initial purchase volume, dropping to a mean 3.0 rebuys per item a year. In 2004 respondents said they made 3.9 rebuys on an item.
Similar to the number of people sourcing for a company, the number of people making purchases increased to an average of 4.0 people from 2.7 last year. Of the individuals making purchases for their primary catalog, 88% also bought for their Website.
Not surprisingly, respondents ranked reliability and quality of product of top importance when rating vendors. Each quality received a score of 4.4 on a scale of one to five. Profit potential trailed closely with a 4.3 ranking, while advertising allowance brought up the rear with an importance ranking of 2.4. (Nearly 46% of respondents, however, didn’t receive any advertising allowance from vendors.) Exclusivity of product climbed in importance to 4.1 from 3.8 last year.
Analysis
Respondents proved their reliance on exclusivity, as 77% requested product modifications for exclusivity from vendors. A mean 16.6% of respondents’ products were modified, compared with a mean 13.6% of products among last year’s participants.
But the percentage of items that were manufactured by respondents’ companies or for them under contract decreased to a mean 25.8% from 30.1% last year. Dollar sales volume from these products dropped over eight percentage points to 39.7%. And only 30% of this year’s participants planned to increased their manufacturing efforts, compared with 42% of last year’s survey participants.
Following forward-shifting sourcing and buying times, respondents also reported a longer lead time before a catalog mailing date for manufacturing items. On average, respondents manufactured items 5.8 months in advance, whereas last year they reported manufacturing 4.1 months prior to the mail date.
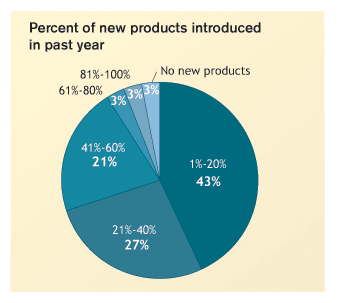
New items introduced during the past year represented a mean 28.4% of this year’s respondents’ merchandise mix. A year ago respondents reported a mean 26.6% of new products. Trending with that data, 36% of those surveyed this year planned to increase the amount of new products during the next 12 months by more than the usual rate, while 42% planned for the same amount.
A merch pro weighs in
The plurality of those surveyed — 48.5% — said they planned to maintain the average price point, while 6.1% planned to decrease the average price point.
Thirty-nine percent of respondents expanded their product niche during the past 12 months. Of those, the majority — 91% — added new categories to their primary catalog; 36% added a special section to their primary catalog, and 27% launched a spin-off catalog.
The most common method of analyzing merchandise among respondents was category analysis, with 87% using the technique. Respondents also used page/spread analysis (74%), square-inch analysis (55%), and price-range analysis (45%).
We asked Jacksonville, FL-based catalog merchandising consultant Leila Griffith, to comment on our survey findings.
Q. Results from our Benchmark on Merchandising show that respondents are sourcing and buying further in advance to a catalog’s mail date. Respondents reported that they sourced items a mean 6.3 months in advance of a catalog mail date in 2005, compared with 5.9 months in 2004. And those surveyed this year reported buying products a mean 5.1 months prior to the mail date this year, compared with 3.9 months in 2004. Why is this?
A. There seem to be more and more people in the organization, from CEO to fulfillment to customer service personnel, who need to pass off on merchandise and categories, so the further the advance planning when sourcing, the better. There may be field-testing needed for the product as well. Advance sourcing also gives purchasing additional time to project inventory requirements.
As far as the purchasing time, longer lead times are often required for special product, and more time for negotiations is always welcome. Most domestic vendors require 60 days’ lead time for initial orders and 30-45 days for reorders, and if they don’t get the orders, they don’t ship. Imported items always have longer lead times, so it’s absolutely necessary to purchase months ahead.
Q. The mean number of both domestic and international sourcing trips has increased from 2004, with respondents making a mean 4.7 domestic trips in 2005, up from 4.0 last year, and a mean 3.0 international trips in 2005, up from 2.5 last year. Additionally, more of those surveyed made international sourcing trips. What accounts for the increase in sourcing trips?
A. It’s so important to take advantage of the myriad trade shows available to us. It’s also advantageous to see what our competition is seeing and buying or not buying. Trade shows are also a good place for buyers to touch base with vendors and address past and current problems and issues. The merchants have more leverage than anyone else in the company when it comes to vendor relations.
Plans for new items in the next 12 months
International sourcing trips may be increasing because there are always foreign vendors who show overseas but don’t come to markets here. So traveling to foreign markets provides opportunities for unique products.
Plans for import activity
If catalogers are willing to commit for more inventory with longer lead times and pay for the product in advance of receipt, there are clearly margin benefits to be had. Merchandise made in Asia is much less expensive than product made in other areas like Europe or Britain, but the panache or quality can be questionable. For any exclusive designs or manufacturers’ items that are modified, it’s imperative to get production samples in advance and to test everything.
Percentage of products modified by vendors
Foreign markets are great for spotting trends and getting ideas. Some of the major markets in Frankfurt or Cologne or Milan can be shopped for unique items. Even if the merchandise is too expensive and/or the perceived value isn’t there, it can be inspiration for product development in Asia. Of course this takes time and money, and planning is essential.
“Do the same people who buy for your catalog also buy for your Website?”
Will increase by more than usual rate 36%
Will increase by usual rate 21%
Will keep about the same number 42%
Total does not equal 100% due to rounding
“Do the same people who buy for your catalog also buy for your stores?”
| 2005 | 2004 | |
|---|---|---|
| Plan to increase importing | 44% | 28% |
| Plan to decrease importing | 6% | 6% |
| No changes planned | 50% | 64% |
| Totals may not equal 100% due to rounding | ||
Where respondents sourced product
5% or less 11%
6%-10% 26%
11%-15% 6%
16%-20% 6%
21%-30% 3%
More than 30% 26%
We don’t request modifications 23%
Mean: 16.6%
Total exceeds 100% due to rounding
“How much of projected volume do you buy initially?”
Yes 88%
No 5%
We don’t sell online 8%
Total exceeds 100% due to rounding
People responsible for merchandise analysis
Yes 40%
No 8%
We don’t have stores 53%
Total exceeds 100% due to rounding
“How do you analyze merchandise?”
United States 98%
Far East 66%
Canada 43%
Western Europe 41%
India 18%
South America 16%
Methodology
1%-19% 5%
20%-39% 40%
40%-59% 24%
60%-79% 18%
80%-99% 8%
100% 5%
Mean: 49%
Merchandiser 50%
Buyer 25%
Consultant 6%
President/owner 19%
Other 34%
Category analysis 87%
Page/spread analysis 74%
Square-inch analysis 55%
Price-range analysis 45%
Do not use analytical techniques 7%
Between Aug. 3 and Sept. 6, Primedia Business e-mailed invitations to participate in an online survey to 1,655 Multichannel Merchant subscribers. Respondents were offered a chance to be entered into a drawing for one of four $50 Amazon.com gift certificates. Three follow-up e-mails were sent to nonrespondents to encourage response. Of the 1,439 deliverable surveys, 49 usable surveys were received, for an effective response rate of 3.4%.
