The more things change on the front end — dazzling new merchandise, cool Websites, innovative marketing campaigns — the more they stay the same on the back end. Logistical and fulfillment processes are often cobbled together, distribution center equipment is less than ideal, and systems integration is patchy at best. And given the industry’s relatively slim profit margins, merchants have traditionally put off investing in new people, processes, or technology — even when market conditions urgently dictated the need to spend.

But when it comes to material handling equipment and processes, multichannel merchants might not be able to delay investments much longer. According to a report from the supply chain consulting firm Establish/Herbert W. Davis and Co., “the cuts in staff and expenses of the past few years have now come home to roost… The physical layouts tolerated during the early years of this decade in many warehouses are just not adequate for the current volumes and special activities required of most operations. Many companies put off making the changes in racking, aisles, staging areas, scales, wrapping equipment, and packing areas that needed to be made and ‘made do’ with what they had. Now as volumes increase, it’s time to get that warehouse laid out properly to be able to handle the volume and the labeling, reworking, tagging, counting, kitting, display assembly, and pallet configuration that today’s customers require.”

How soon this can be accomplished is open to question. The results of Multichannel Merchant/O+F’s most recent survey of material handling benchmarks are somewhat different from those we saw in 2003, but enough of the responses remain the same to raise some doubt as to how quickly direct merchants will rise to the challenge of modernizing and streamlining their distribution processes.
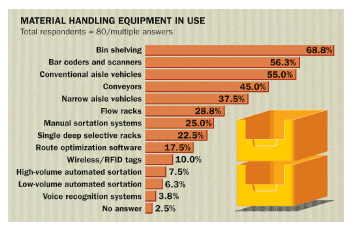
Take the fulfillment center equipment and systems they currently use. We were surprised to find that there seems to be, if anything, less automation today than was reported two years ago: 56.3% of the respondents deployed bar coders and scanners, a noticeable drop from 65.5% in 2003; the use of flow racks plunged to 28.8% from 41.6%; and conveyors, used by 57.5% of the 2003 respondents, were now used by just 45.0%. And it isn’t as if these workhorse items have been replaced by anything jazzier. A slightly higher percentage of this year’s respondents used voice recognition systems (3.8% vs. 2.7%), but wireless and RFID installations stalled at about 10.0% of the sample, and not a single respondent to the most recent survey used pick-to-light systems, compared with 3.5% of participants in the previous survey.

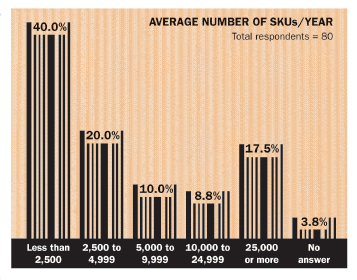
MANUAL LABOR Other aspects of fulfillment centers mirrored the meagerness of their equipment. More respondents (17.1% vs. 12.9%) outsourced order fulfillment activities and were trying to do the proverbial “more with less” back at the warehouse. The facilities themselves apparently shrank, with median square footage falling from 52,500 to 37,646, and this year more fulfillment centers (27.5% vs. 19.5%) sent out fewer than 100 shipments a day. Overall the median number of shipments per day slumped markedly during the past two years, diving from 750 to 462 during peak periods and from 358 to 162 during off-peak. This may have something to do with the lack of sufficient personnel to handle those shipments: The median number of full-time material handling employees fell from 29 to 20 at peak periods and from 19 to 12 at slower times, and even though the number of temporary workers rose from 4 to 10 during the peak season, it remained at zero the rest of the time. Yet 17.5% of this year’s respondents handled more than 25,000 SKUs a year, a significant jump from the 9.7% that did so in 2003.
Fulfillment processes remained static. Close to half (44.8%) of the respondents still used manual methods, and a slight increase in electronic processing (20.2% vs. 17.2%) was offset by a dip in real-time processing (11.4% vs. 12.7%). More respondents said they now performed automated quality checks, but the majority — 70% — continued to use manual inspection. On the bright side, the number of companies that checked all orders rose considerably, to 71.4% from 52.7% in our previous study.
Although we can’t prove this statistically, the emphasis on quality may have had some effect on merchandise return rates, which show a striking improvement. Two years ago, 38.9% of our respondents reported a return rate of less than 2%; this year 46.3% had less than 1% of all their orders returned. The number of respondents who experienced return rates of 15% or higher also declined, from 7.1% to 3.8%.

Again on the positive side, backorders have decreased. Half (50.1%) of the merchants reported a full or partial backorder rate of less than 2%, up from 34.5% of those surveyed in 2003. On the other hand, in our previous survey 18.6% of the respondents reported a 5%-9% backorder rate; this year the percentage of respondents in that category rose to 21.3%. The portion of respondents in the highest backorder bracket — 15% or more — was all but flat at 12.5% compared with 12.4% in 2003.
COMING AROUND In keeping with their generally leaner operations, merchants have become savvier when it comes to handling overstocks, looking for swift and cost-effective ways to liquidate extra inventory. A sizable 25.0% of this year’s respondents recycled their overstocks, compared with 18.6% of those two years ago. A far smaller portion of merchants today (17.5% vs. 25.7%) used electronic or interactive catalogs to get rid of excess product; in addition to recycling, favored methods to liquidate overstocks included returning items to the vendor (35.0%), sale catalogs (20.0%), warehouse sales (20.0%), and tactics such as donations, employee sales, giveaways, and write-offs (18.8%).
Not surprisingly, this attention to inventory management has resulted in fewer products gathering dust on the warehouse shelves. Inventory turns have surged during the past two years. Back in 2003, the number of respondents who turned their inventory six to nine times a year was 9.7%. This year those high achievers totaled 21.3% of the sample. Two years ago 11.5% of respondents turned their inventory 10 times or more in the course of a year; in our latest survey, 16.3% reported doing so.
AIN’T GOT NO SATISFACTION Customer service has long been an Achilles’ heel for direct merchants, and we’re puzzled as to why it continues to be that way. Perhaps it’s because a significant number of merchants (36.3% in our survey, only a marginal improvement over the 41.6% recorded two years ago) said they didn’t formally measure customer satisfaction. Among those that reported doing so, the use of common measures such as surveys, e-mail follow-ups, and focus groups declined considerably; in particular, the use of in-package customer surveys among respondents plummeted from 30.3% to 7.8%. As in 2003, the most widely used techniques to measure customer satisfaction were return/cancellation rates (37.3%) and service calls/letters as a percentage of shipments (25.5%), although use of even these tactics has declined somewhat.

It appears that process improvements have also been slow to materialize. The percentage of respondents picking fewer than 25 units/lines per hour rose from 15.9% to 25.0% at peak periods and from 25.7% to 33.8% during off-peak periods. Packing is in a similar slump. Twenty percent of our respondents, as opposed to 15.9% two years ago, packed fewer than 10 orders per hour during peak season. The decline was also apparent at off-peak times, when 32.5% of respondents, compared with 25.7% in 2003, packed fewer than 10 orders an hour. The slowdown may be partly attributable to the leaner staff and facilities of small and midsize operations; the number of companies that packed 200 or more orders an hour has remained largely stable since our earlier survey.

Despite their obvious lack of material handling resources, merchants somehow managed to reduce the time between receiving an order and shipping it. The number of respondents who took 12 hours or less from order receipt to shipment at peak periods rose from 41.5% to 50.0%, and of that group, 17.5% got the shipment out in less than four hours. There were still plenty of laggards, though. Of this year’s respondents, 17.5% took 13-24 hours to ship an order, and 13.8% availed themselves of 25-48 hours to perform the task. Despite increasing customer demands for fast delivery, this year more retailers (7.5% vs. 6.2% two years ago) took 48 hours or more to ship orders at peak.
It’s no wonder, then, that the majority hit their order shipment targets less frequently than they used to. In 2003, 20.4% of our respondents met order shipment objectives 85%-94% of the time; just 15% of this year’s respondents made those numbers. At roughly 35%, the portion of respondents meeting order shipment targets 95%-98% of the time remained the same. Fifteen percent of this year’s respondents, up from just 6.2% two years ago, claimed to reach their shipment targets 100% of the time, but given the overall picture of stripped-down, bare-bones operations that emerges from our survey results, we’re skeptical.
In fact, the somewhat apathetic attitude to industry issues that we’re seeing in our respondents reinforces the perception of warehouse executives preoccupied with putting out daily fires and not particularly focused, at least for the time being, on long-term strategies. On a scale of 1 to 6, with 1 standing for “not at all important” and 6 representing “extremely important,” the highest ranking went to performance measurement, which, at 4.4, received a lower score than last year’s modest 4.8. Even labor retention, generally a strong concern with our respondents, obtained just a 4.2 rating, down from 4.4 in the previous study, and the issue of upgrading information technology slipped in the ranking from 4.4 to 4.3, a telling comment on just how cash- and resource-strapped the material handling business is today.
METHODOLOGY
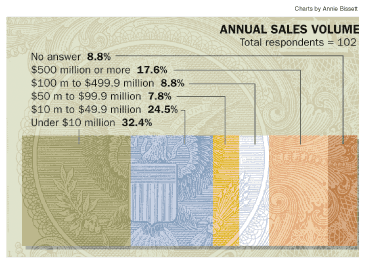
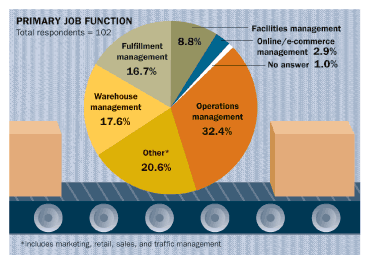
On Oct. 6, 2005, Primedia Business Marketing Research mailed a one-page cover letter and a 26-question survey to 1,000 domestic subscribers of Multichannel Merchant/O+F selected on an nth-name basis from the job function category of “operations management.” A postage-paid business reply envelope and a $1 incentive were included in the mailing. By Nov. 14, 102 usable surveys were received, for a response rate of 10.4%. Means and medians were calculated according to standard statistical practices. Results were reported in three categories: companies with annual sales of less than $10 million, $10 million-$49.9 million, and at least $50 million. Among the responding companies, 32.4% sold less than $10 million in merchandise last year; 24.5%, $10 million-$49.9 million; and 34.2%, at least $50 million (In the last category, 17.6% of the respondents reported annual sales of $500 million or more.) Of the total sample, 8.8% did not provide an annual sales figure. The survey respondents were in operations management (32.4%), warehouse management (17.6%), fulfillment management (16.7%), facilities management (8.8%), and online/e-commerce management (2.9%); 1.0% of the respondents did not provide a job function, and 20.0% were in “other” occupations such as corporate management and production, marketing, retail, traffic, and sales management. Primedia Business research manager Thomas Grant administered the survey and gathered the data for this report. To buy a copy of the complete study, visit www.multichannelmerchant.com/research/.
Case study: automation and space
Top-of-the-line material handling equipment can be pricey, but it can also pay for itself very quickly, as global manufacturer/distributor Bauer Compressors has learned. Based in Norfolk, VA, the company, which designs and makes high-pressure compressors and purification systems for commercial markets, found that it had no room to grow the manufacturing part of its business.
With nearly all its parts stored in shelving, the parts department at Bauer Compressors was using more than 100 sections of shelving, occupying 4,500 sq. ft. of warehouse space. The company’s solution was to install three Shuttle vertical lift modules (VLMs) and a batch-picking system from automated storage and retrieval systems provider Remstar International. The system reduced the size of the parts department to 395 sq. ft., enabling Bauer Compressors to add more work cells and increase parts inventory from 3,000 SKUs located in the shelving to 4,500 SKUs located in the VLMs. Using an integrated software system with the automated VLMs, one person can do all the order picking.
PLAYING THE PART As in many other companies, the parts department at Bauer Compressors has two types of customers: external customers who need spare parts shipped to their location and internal customers on the manufacturing floor who need parts to build the compressors. The order entry department enters spare parts orders and job orders into the host enterprise planning (ERP) system, by Made2Manage Systems. The orders are held in queue until the parts department is ready to begin fulfilling them. The ERP system is integrated with Remstar’s FastPic4 inventory management software, which manages the VLMs’ work zone.
The operator selects up to eight orders to be picked simultaneously, creating a batch. The batch station features a put light indicator in front of eight positions (one for each order). The operator places a tote in front of each put light, and the FastPic4 software automatically looks for SKU commonality within the batch and associates each tote with an order.
FastPic4 then directs the Shuttle VLMs to retrieve the trays required. As each tray is presented in the pick window, a pick light indicates which SKU to pick, and the quantity is shown on the unit’s display screen. The operator picks the required quantity out of the VLM and turns around to the batch station to distribute the product among the orders. Put lights direct the operator as to what quantity to put in each tote.
As the operator places the items in the correct order, he presses the task-complete button in front of the tote, indicating that the quantity for that order has been fulfilled. When the last task-complete button for that part is pushed, the VLM immediately retrieves the next part. As the picker is picking from the first VLM, units two and three are presenting trays for the next picks. This process is repeated until the entire batch has been picked; the totes are then routed to the manufacturing floor or to shipping.
If there is an immediate need on the floor for a part during batch picking, the operator does a “hot pick” by using a pause button in the FastPic4 software that suspends the automated process and allows the operator to pull a part or parts from the VLMs. When the hot pick is completed the operator continues from where he left off.
IT’S IN THE BAG Bauer Compressors has also incorporated a “bagging and tagging” picking process to handle quantities of small parts such as bolts, screws, and washers. When parts are picked from the VLM tray, a label is automatically printed with the part name and SKU number. Each part is counted, sealed in a plastic bag, and labeled before being placed in the order bin on the batch station. “Before this system, we had part numbers handwritten on some parts and not at all on others,” says operations manager Joseph Stark. “It made it difficult to find parts when picking an order, and it was a nightmare for restocking unused or returned parts.”
Multiple storage location features in FastPic4 allow parts to be stored randomly in the VLMs, making it easy to add parts and locations and track inventory levels. For inventory replenishment, FastPic4’s pick-to-light technology directs the worker to where a new part number or overstock product should be stored. Using the Shuttle VLMs to store product has also provided more inventory security because a special code is required to operate the machines.
— RR