

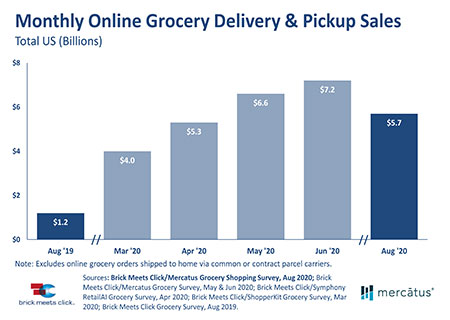
While total e-grocery sales in the U.S. declined 20% in August vs. June to $5.2 billion, other factors indicate strength in the sector, such as growth in average order value and repeat usage intent, according to a survey by Mercatus and Brick Meets Click.
The AOV for an online grocery order reached a high of $95, the survey found, 32% higher than a year ago, while 75% of households surveyed said they were likely or very likely to order online within the next 30 days, up from 57% in June.
The one-fifth drop in total e-grocery sales could be attributed to the fact that the number of consumers indicating concern about contracting COVID-19 has been steadily declining, from a high of 47% in April to 38% in August.
The $5.2 billion total of e-grocery sales excludes items shipped to home via “common or contract parcel carriers” as grocery deliveries are not coming from UPS, FedEx and the U.S. Postal Service but almost entirely from app-based startups like DoorDash, Postmates, Instacart and Shipt.
“There is a common belief that the rapid and dramatic surge in sales caused by COVID-19, starting in mid-March, would recede at some point as stay-at-home orders and in-store shopping restrictions like occupancy limits, shortened hours and one-way aisles were relaxed,” said David Bishop, a partner at Brick Meets Click, in a release. “While the August results reflect a retrenchment of sorts, the market appears positioned to begin a new growth cycle with a large base of committed shoppers.”
While in-store shopping remains the predominant mode of grocery purchase, e-grocery as a consumer behavior has continued to gain steam during the pandemic. The survey found that about 29% of U.S. households, or 37.5 million, are defined as active users of e-grocery – placing at least one pickup or delivery order per month – compared to 13% or 16.1 million households a year ago, a 133% increase.
The survey found active online grocery shoppers are doing so more frequently as well, placing 1.6 orders per month in August, compared to 1.0 orders a year earlier.
Brick Meets Click conducted the survey on Aug. 24-26, 2020 with 1,817 adults 18 years and older. Results were adjusted based on internet usage among U.S. adults to account for non-response bias.