Amazon vs. Walmart: touch gloves and come out swinging! (image credit: University of Pennsylvania/Wharton)
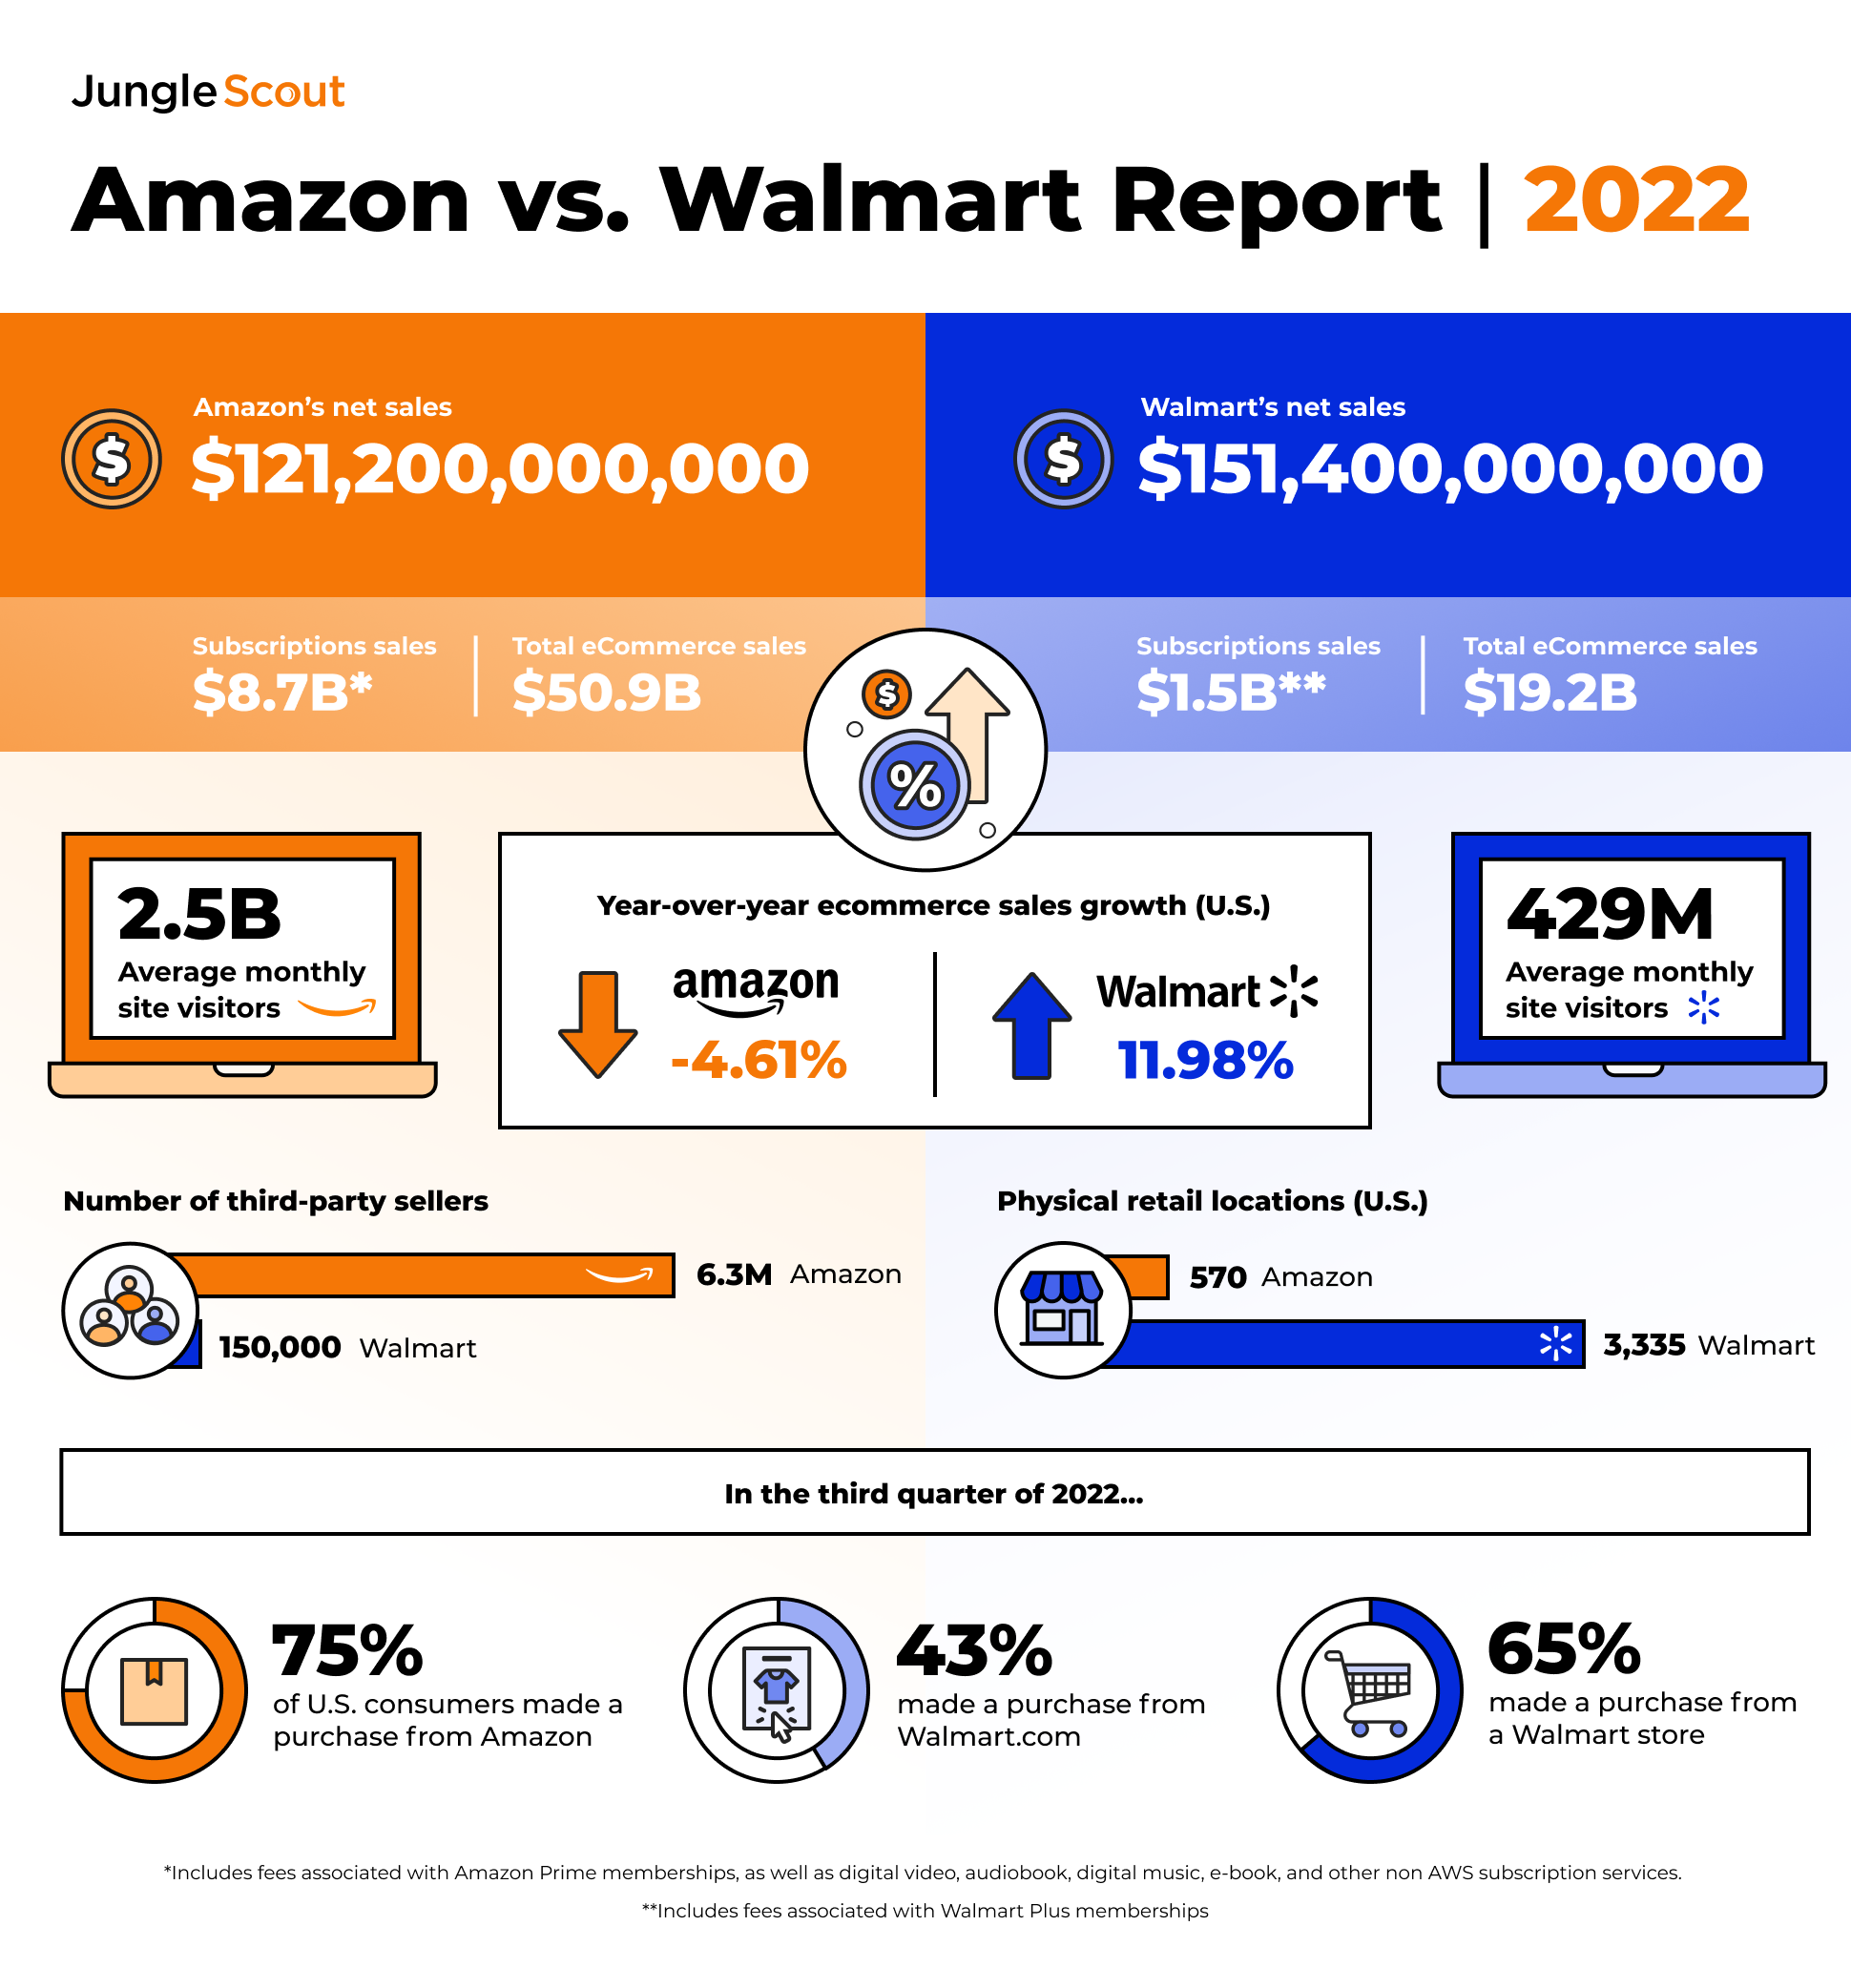
While Amazon is the clear market leader in ecommerce sales, at $50.9 billion to $19.2 billion in 2022, arch-rival Walmart has been gaining in some respects in their ongoing retail industry cage match, as evidenced in the divergence of the most recent quarterly reports of each.
Jungle Scout has developed a helpful infographic that details some key comparison metrics between the two behemoths. For instance, Walmart is running at 12% annual growth in ecommerce sales, while Amazon is down about 7%. Yahoo Life even called out Walmart.com for superior post-Cyber Monday deals.
And while 75% of U.S. consumers made a purchase from Amazon in Q3, slightly less (65%) walked in and walked out with something from one of Walmart’s 3,335 domestic stores. Something less than half (43%) bought something on Walmart.com.
Jungle Scout gathered data from a quarterly survey of 1,000 U.S. adults, and from an annual survey of more than 3,500 first-and third-party Amazon and/or Walmart sellers.
Here’s the infographic: